Thursday 29 September 2011

Global financial crisis


New York Stock Exchange
 A trader at the New York stock exchange. The last four years have seen five key stages of the global financial crisis, with more likely to come.
  9 August 2007. 15 September 2008. 2 April 2009. 9 May 2010. 5 August 2011. From sub-prime to downgrade, the five stages of the most serious crisis to hit the global economy since the Great Depression can be found in those dates.
Phase one on 9 August 2007 began with the seizure in the banking system precipitated by BNP Paribas announcing that it was ceasing activity in three hedge funds that specialized in US mortgage debt. This was the moment it became clear that there were tens of trillions of dollars worth of dodgy derivatives swilling round which were worth a lot less than the bankers had previously imagined.
Nobody knew how big the losses were or how great the exposure of individual banks actually was, so trust evaporated overnight and banks stopped doing business with each other.
It took a year for the financial crisis to come to a head but it did so on 15 September 2008 when the US government allowed the investment bank Lehman Brothers to go bankrupt. Up to that point, it had been assumed that governments would always step in to bail out any bank that got into serious trouble: the US had done so by finding a buyer for Bear Stearn while the UK had nationalized Northern Rock.
When Lehman Brothers went down, the notion that all banks were "too big to fail" no longer held true, with the result that every bank was deemed to be risky. Within a month, the threat of a domino effect through the global financial system forced western governments to inject vast sums of capital into their banks to prevent them collapsing. The banks were rescued in the nick of time, but it was too late to prevent the global economy from going into free fall. Credit flows to the private sector were choked off at the same time as consumer and business confidence collapsed. All this came after a period when high oil prices had persuaded central banks that the priority was to keep interest rates high as a bulwark against inflation rather than to cut them in anticipation of the financial crisis spreading to the real economy.
The winter of 2008-09 saw co-ordinates action by the newly formed G20group of developed and developing nations in an attempt to prevent recession turning into a slump. Interest rates were cut to the bone, fiscal stimulus packages of varying sizes announced, and electronic money created through quantitative easing. At the London G20 summit on 2 April 2009, world leaders committed themselves to a $5tn (£3tn) fiscal expansion, an extra $1.1tn of resources to help the International Monetary Fund and other global institutions boost jobs and growth, and to reform of the banks. From this point, when the global economy was on the turn, international co-operation started to disintegrate as individual countries pursued their own agendas.
9 May 2010 marked the point at which the focus of concern switched from the private sector to the public sector. By the time the IMF and theEuropean Union announced they would provide financial help to Greece, the issue was no longer the solvency of banks but the solvency of governments. Budget deficits had ballooned during the recession, mainly as a result of lower tax receipts and higher non-discretionary welfare spending, but also because of the fiscal packages announced in the winter of 2008-09. Greece had unique problems as it covered up the dire state of its public finances and had difficulties in collecting taxes, but other countries started to become nervous about the size of their budget deficits. Austerity became the new watchword, affecting policy decisions in the UK, the eurozone and, most recently in the US, the country that stuck with expansionary fiscal policy the longest.
Last Friday, the morphing of a private debt crisis into a sovereign debt crisis was complete when the rating agency, S&P, waited for Wall Street to shut up shop for the weekend before announcing that America's debt would no longer be classed as top-notch triple A. This could hardly have come at a worse time, and not just because last week saw the biggest sell-off in stock markets since late 2008. Policymakers are confronted with a slowing global economy and a systemic crisis in one of its component parts, Europe. To the extent that they are united, they are united in stupidity, wedded to blanket austerity that will make matters worse not better. And they have yet to tackle the issue that lay behind the 2007 crisis in the first place, the imbalances between the big creditor nations such as China and Germany, and big debtors like the US.
In the circumstances, it is hard to be wildly optimistic about how events will play out. Markets are bound to remain highly jittery, although it seems unlikely that American bond yields will rocket as a result of the S&P downgrade. Japan lost its triple A rating long ago and has national debt well in excess of 200% of GDP but its bond yields remain extremely low. The reason for that is simple: Japan's growth prospects are poor.
So are America's, which is why bond yields will remain low in what is still, for the time being, the world's biggest economy. The dressing down given to Washington by Beijing following the S&P announcement was, however, telling. Growth rates of close to 10% mean that the moment China overtakes the US is getting closer all the time, and the communists in the east now feel bold enough to tell the capitalists in the west how to run their economies. Whatever it means for financial markets this week, 5 August 2011 will be remembered as the day when US hegemony was lost.
All this is terrible news for Barack Obama. He has not delivered economic recovery. The US is drowning in negative equity and foreclosed homes. No president since Roosevelt has won an election with unemployment as high as it is today. Fiscal policy will be tightened over the coming months as tax breaks expire and public spending is cut. The Federal Reserve only has the blunt instrument of QE with which to stimulate the economy, and will only be able to deploy it after a softening up process for the markets that will take several months. On top of that, Obama will now be branded as the president who presided over the national humiliation of a debt downgrade. He looks more like Jimmy Carter than FDR.
Not that the Europeans should get too smug about this, because what we are witnessing is not just the decline of the US but the decline of the west. One response to last week's meltdown was the announcement of talks between the G7 – the US, the UK, Germany, Italy, France, Canada and Japan – but while this would have been appropriate 20 years ago it is not going to calm markets today. Holding a G7 meeting without China today is like expecting the League of Nations without the US to tackle totalitarianism in the 1930s.
There is no happy ending to this story. At best there will be a long period of weak growth and high unemployment as individuals and banks pay down the excessive levels of debt accumulated in the bubble years. At worst, the global economy will be plunged back into recession next year as the US goes backwards and the euro comes apart at the seams. The second, gloomier scenario, looks a lot more likely now than it did a week ago.
Why? Because there is no international co-operation. There are plans for austerity but no plans for growth. Even countries that could borrow money for fiscal stimulus packages reluctant to do so. Europe lacks the political will to force the pace of integration necessary to avoid disintegration of the single currency.
Commodity prices are coming down, but that is the only good news. We are less than halfway through the crisis that began on 9 August 2007. That crisis has just entered a dangerous new phase.

Tuesday 27 September 2011

Russian Federation economic review


The Russian economy underwent tremendous stress in the 1990s as it moved from a centrally planned economy to a free market system. Difficulties in implementing fiscal reforms aimed at raising government revenues and a dependence on short-term borrowing to finance budget deficits led to a serious financial crisis in 1998. Lower prices for Russia's major export earners (oil and minerals) and a loss of investor confidence due to the Asian financial crisis exacerbated financial problems. The result was a rapid and steep decline (60%) in the value of the ruble, flight of foreign investment, delayed payments on sovereign and private debts, a breakdown of commercial transactions through the banking system, and the threat of runaway inflation.

The Russian economy bounced back quickly from the 1998 crisis and enjoyed over 9 years of sustained growth averaging about 7% due to a devalued ruble, implementation of key economic reforms (tax, banking, labor and land codes), tight fiscal policy, and favorable commodities prices. Household consumption and fixed capital investments both grew by about 10% per year during this period and replaced net exports as the main drivers of demand. Inflation and exchange rates stabilized due to a prudent fiscal policy (Russia ran a budget surplus from 2001-2008). Foreign exchange reserves grew to almost $600 billion by mid-2008, the third-largest in the world, of which more than $200 billion were classified as stabilization funds designed to shelter the budget from commodity price shocks. The balance of payments experienced twin surpluses until mid-2008 in the current and capital accounts, which accounted for the phenomenal growth of reserves. As of July 1, 2006, the ruble became convertible for both current and capital transactions. Russia repaid its entire Soviet-era Paris Club debt of $22 billion in late 2006, but by October 2008 foreign external debt totaled $540 billion, of which $500 billion was owed by banks and corporations, including state-owned enterprises.

The global economic crisis hit Russia hard, starting with heavy capital flight in September 2008, which caused a crisis in its stock market. Several high-profile business disputes earlier in 2008, such as TNK-BP and Mechel, as well as the Georgian war helped drive capital out of Russia. By mid-September, Russia’s stock market had collapsed, as businesses sold shares to raise collateral for margin calls required by international lending institutions. As the global financial crisis gathered steam in the fall of 2008, the accompanying steep fall in global demand, commodity prices, and tightening of credit served to almost bring Russia’s economic growth to a halt in the fourth quarter of 2008, to 1.1% down from 9.5% during the same period in 2007. The Central Bank of Russia responded by pumping liquidity into Russian banks, which helped avert a banking crisis. At the same time, the government attempted a managed devaluation, which successfully avoided a run on the ruble and bank deposits but at the cost of a steep decline in foreign exchange reserves to $387 billion by mid-February 2009. This in turn prompted the S&P and Fitch rating agencies to downgrade Russia’s sovereign debt to the lowest investment grade. By 2010, however, the Russian economy had begun a modest recovery, bolstered by government anti-crisis policies, the global rebound, and a rise in oil prices. Russia’s leaders put renewed emphasis on promoting innovation as key to economic modernization as well as on the need to diversify the economy away from oil and gas.

Gross Domestic Product
Tighter credit, collapsing global demand, global uncertainty, and rising unemployment hurt investment and consumption, and led Russia to have -7.9% GDP growth in 2009--a sharp contrast to the pre-crisis performance of 8.1% in 2007. However, 2010 saw Russia’s economy return to growth with a 3.8% increase in GDP. Russia’s Economic Development Ministry predicts that the nation’s GDP will grow 4.2% in 2011.

Monetary Policy
For most of the past decade, Russia experienced persistent inflation, gradually declining from 85% in late 1998 to 9% by end-2006. However, a combination of surging international food and energy prices and looser monetary and fiscal policy pushed the Consumer Price Index (CPI) to 11.9% by the end of 2007, and up to 15% in early 2008. The Central Bank of Russia (CBR) monetary policy tended to be limited to managing the ruble’s exchange rate against a bi-currency basket of dollars and euros. The CBR intervened to keep the ruble stable during times of volatile international commodity prices and to manage inflation. In years of record high oil prices, the Central Bank typically purchased dollars to prevent real appreciation of the ruble. These interventions initially had limited effect on inflation, as they were mostly sterilized by budget surpluses and demand for rubles grew in a robust era of economic growth. By 2007, fiscal policy and the balance of payments were the actual drivers of monetary policy, particularly as large capital inflows due to increased borrowing by Russian banks and corporations caused the money supply to swell and added to inflationary pressures. Inflationary pressures eased in late 2008 as energy and commodity prices collapsed and international credit flows virtually stopped, causing money supply growth to halt. Inflation decelerated in 2009 to about 8.9% compared with 13.3% the previous year, owing to residual effects of the economic downturn, and continued to fall to 6.7% in 2010. Some forecasters predict this inflation rate will remain throughout 2011, though others believe the accelerated inflation Russia experienced in the first 2 months of the year could persist, leading to inflation in the 9%-10% range during the first half of 2011.

Government Spending/Taxation
The Russian federal budget ran growing surpluses from 2001-2007, as the government taxed and saved much of the rapidly increasing oil revenues. The government overhauled its tax system for both corporations and individuals in 2000-2001, introducing a 13% flat tax for individuals and a unified tax for corporations, which improved overall collection. Responding to demands from the oil sector, the government reduced the tax burden on oil production and exports, but only marginally. Tax enforcement of disputes continues to be uneven and unpredictable. In 2007 the federal budget surplus was 5.5% of GDP, and in 2008 the government ended the year with a surplus of 4.1% of GDP. Although the government revised its budget projections during 2009 to reflect lower oil prices and the effects of the economic crisis, it ended the year with a budget deficit amounting to 7.9% of GDP, which it financed from the Reserve Fund, one of the government’s two stabilization funds. The government’s anti-crisis package in 2008 and 2009 amounted to about 6.7% of GDP, according to World Bank estimates. The package provided support to the financial sector and enterprises--through liquidity injections to banks and tax cuts/fiscal support to enterprises--as well as modest support for households and small and medium enterprises (SMEs) and increased unemployment benefits. By the end of 2010, due to improving economic conditions, Russia had lowered its budget deficit to 3.9% of GDP. The government hoped to lower it to 3.6% in 2011 and admitted that deficits may be in place through 2015 and beyond.

Population
Russia's population was 139.39 million as of July 2010, a decrease from the previous year according to the government statistics service and the Ministry of Public Health. The birth rate in 2010 was 11.11 live births for every 1,000 people, a statistic which ranked Russia 176th out of 224 countries. Life expectancy remains low compared to developed countries, averaging 59.54 years for men and 73.17 years for women in 2010. Cardiovascular diseases, cancer, traffic accidents, and violence continue to be major causes of death among working age men. Many premature deaths are attributed to excessive alcohol consumption and smoking. A truly healthy Russia will require serious improvements in the health sector and some major changes in current cultural norms. To combat the looming demographic crisis, in October 2007 then-President Putin approved the concept of demographic policy for the years 2008-2025. The program aims to increase life expectancy, reduce mortality, increase the birth rate, improve the population's health, and develop a sound migration policy. The government instituted the National Priority Health Project and "mother's capital" in order to slow the population decline. These programs had short-term success; Russia's population declined by 0.25% in 2008, compared to 0.4% in 2007. It is unknown if such programs offer a long-term solution. Russian statistics show a slight increase in the population in 2009; inward migration is the primary cause. In April 2008, the government approved joining the World Health Organization's Framework Convention on Tobacco Control, which is expected eventually to reduce extremely high smoking rates, and the government put significant amounts of money into prevention of smoking and alcohol abuse in the 2009-2011 budget.

HIV/AIDS
As of the end of October 2009, there were 516,167 HIV cases officially registered in Russia, though some experts believe the actual number may be as many as 1 million HIV cases. According to UNAIDS, 60,000 new HIV cases were documented in Russia in 2009, an 8% increase from 2008. The prevalence of HIV cases was 300 per 100,000 people in 2008, higher than the 2007 indicator of 270.1 per 100,000. The chief form of transmission continues to be intravenous drug use, which accounted for over 60% of new HIV cases in 2009; among HIV-positive injecting drug users, about 85%-90% are Hepatitis C positive. More than 44% of new HIV cases are identified in females, and transmission through heterosexual sex has grown rapidly. The Government of Russia implements HIV treatment and prevention programs through its National Priority Health Project, Federal Targeted Program, and Global Fund Grants. The government currently spends over $250 million per year on HIV/AIDS treatment programs and allocated over $42 million for the period of 2007-2010 to support HIV/AIDS vaccine research. Approximately 68,000 patients are receiving antiretroviral therapy, and the government hopes that number will exceed 100,000 patients by 2012. Russia and the United States cooperate closely to fight HIV/AIDS, including in third countries. For instance, American and Russian experts have collaborated to develop and introduce in Russian medical schools a new curriculum on HIV infection. The materials, which are based on national and international experience, standards and best practices, will be used to train the estimated 25,000 foreign students that attend Russian medical schools each year.

Commercial Law
Russia has a body of conflicting, overlapping and rapidly changing laws, decrees and regulations, which has resulted in an ad hoc and unpredictable approach to doing business. In this environment, negotiations and contracts from commercial transactions are complex and protracted. Uneven implementation of laws creates further complications. Regional and local courts are often subject to political pressure, and corruption is widespread. However, more and more small and medium businesses in recent years have reported fewer difficulties in this regard, especially in the Moscow region. In addition, Russian businesses are increasingly turning to the courts to resolve disputes. Russia's World Trade Organization (WTO) accession process is also helping to bring the country's legal and regulatory regime in line with internationally accepted practices.

Natural Resources
The mineral-rich Ural Mountains and the vast oil, gas, coal, and timber reserves of Siberia and the Russian Far East make Russia rich in natural resources. However, most resources are located in remote and climatically unfavorable areas that are difficult to develop and far from Russian ports. Nevertheless, Russia is a leading producer and exporter of minerals, gold, and all major fuels. Natural resources, especially energy, dominate Russian exports. Over two-thirds of Russian exports to the United States are fuels, mineral oil, or metals.

Industry
Russia is one of the most industrialized of the former Soviet republics. However, years of very low investment have left much of Russian industry antiquated and highly inefficient. Besides its resource-based industries, it has developed large manufacturing capacities, notably in metals, food products, and transport equipment. Russia is now the world's third-largest exporter of steel and primary aluminum. Russia inherited most of the defense industrial base of the Soviet Union, so armaments remain an important export category for Russia. Efforts have been made with varying success over the past few years to convert defense industries to civilian use, and the Russian Government is engaged in an ongoing process to privatize many of the state-owned enterprises.

Agriculture
Russia has relatively little area for agriculture, but given its massive expanses, the country still accounts for about 9% of the world's arable land. Grain production for export is concentrated in the south of European Russia, with additional grain for domestic consumption grown throughout the rest of non-Arctic Russia west of the Urals as well as western Siberia. Livestock production was in decline from 1990 to 2006, when new government support policies were instituted to stimulate cattle and hog raising. Poultry production has rebounded and is rising at 17% per year. Small plots averaging one acre in size, urban and suburban gardens, and gardening cooperatives produce over half of Russia's food output. Former state and collective farms have been largely privatized, but management quality is uneven and profitability is highly dependent on proximity to major urban markets. Foreigners are not allowed to own farmland, although long-term leases are permitted.

Investment/Banking
Foreign direct investment (FDI) in 2009 fell to less than $40 billion after reaching an all-time high of $75 billion in 2008. Much of the FDI in recent years was Russian capital “returning home,” from havens like Cyprus and Gibraltar, and these flows reversed during the economic downturn. Moreover, although the annual flow of FDI into Russia was in line with those of China, India, and Brazil, Russia's per capita cumulative FDI lagged far behind such countries as Hungary, Poland, and the Czech Republic. Most foreign mergers and acquisitions in 2009 were in the politically sensitive energy sector, largely because of the huge capital requirements required relative to other sectors. By the end of 2010, analysts predicted that the total FDI for the year would again top $40 billion, but not reach the levels seen in 2008.

Although still small by international standards, the Russian banking sector before the crisis was growing fast and becoming a larger source of investment funds. To meet a growing demand for loans, which they were unable to cover with domestic deposits, Russian banks borrowed heavily abroad in 2007-2008, accounting for 57% of the private-sector capital inflows in 2007. Ruble lending has increased since the October 1998 financial crisis, and in 2007 loans were 66% of total bank assets, with consumer loans posting the fastest growth at 57% that same year. In 2004, Russia enacted a deposit insurance law to protect deposits up to 100,000 rubles (about $3,700) per depositor. Amendments to the law in the fall of 2008 increased the Deposit Insurance Agency's 100%-coverage for deposits up to 700,000 rubles. The vast majority of Russians keep their money in the banking sector. The combination of liberalized capital controls and ruble appreciation against the dollar in 2005-2008 persuaded many Russians to keep their money in ruble- or other currency-denominated bank deposits. In 2007, total retail deposits grew by 35%, with foreign currency deposits accounting for 13% of the total. Despite the onset of the crisis, deposits rose by 14% in 2008 and 27% in 2009.

Even with the banking sector’s recent growth, financial intermediation in the overall economy remains underdeveloped. Contradictory regulations across the banking and securities markets have hindered efforts to transfer resources from capital-rich sectors, such as energy, to capital-poor sectors, such as agriculture and manufacturing. The sector is dominated by large state banks, and concentrated geographically in Moscow and the Moscow region. Thus financial service providers face little competition for resources and charge relatively high interest rates for favored, large corporate borrowers.

This state of affairs makes it difficult for entrepreneurs to raise capital, and banks generally perceive small and medium commercial lending as risky. Most of the country’s financial institutions are inexperienced with assessing credit risk, though the situation is improving. The low level of trust, both between the general public and banks as well as among banks, makes the system highly susceptible to crises. After an uncertain year in 2009, by spring 2010 Russian officials announced an end to anti-crisis bank support, and a World Bank report said that “a systemic banking crisis had been averted, the liquidity crunch eased and depositor confidence reestablished.” The report cautioned, however, that systemic weaknesses exposed during the crisis--especially excessive dependence on foreign borrowing and non-performing loans--still needed to be addressed.

Trade
After hitting lows in 2009, trade between the U.S. and Russia grew to $31.7 billion in 2010, an increase of 35% from 2009. U.S. imports from Russia grew 41% year over year to $25.7 billion while exports to Russia increased just 13% to $6.0 billion. The rapid increase in U.S. imports from Russia from 2009 to 2010 can be attributed to the low base year and nascent economic recovery in the United States, but also to the rising price of oil and other commodities. Oil and oil products represent over two-thirds of the value of all U.S. imports from Russia. Russia is currently the 32nd-largest export market for U.S. goods. Russian exports to the U.S. were fuel oil, inorganic chemicals, aluminum, and precious stones. U.S. exports to Russia were machinery, vehicles, meat (mostly poultry), aircraft, electrical equipment, and high-tech products.

Russia's overall trade surplus in 2009 was approximately $100 billion--compared with $180 billion in 2008 and $129 billion in 2007--a reflection of the slower growth in exports and severe contraction of imports. World prices continue to have a major effect on export performance, since commodities--particularly oil, natural gas, metals, and timber--comprise nearly 90% of Russian exports. Russian GDP growth and the surplus/deficit in the Russian Federation state budget are closely linked to world oil prices.

Russia is in the process of negotiating terms of accession to the World Trade Organization (WTO). The U.S. and Russia concluded a bilateral WTO accession agreement in late 2006, and negotiations continue on meeting WTO requirements for accession. Both Prime Minister Vladimir Putin and the General Director of the WTO, Pascal Lamy, stated in early 2011 that they felt Russia would join within the year.

According to the 2010 U.S. Trade Representative's National Trade Estimate, Russia continues to maintain a number of barriers with respect to imports, including tariffs and tariff-rate quotas; discriminatory and prohibitive charges and fees; and discriminatory licensing, registration, and certification regimes. Discussions continue within the context of Russia's WTO accession to eliminate these measures or modify them to be consistent with internationally accepted trade policy practices. Non-tariff barriers are frequently used to restrict foreign access to the market and are also a significant topic in Russia's WTO negotiations. In addition, Russia’s lax enforcement of intellectual property rights had led to large losses for U.S. audiovisual and other companies and is an ongoing irritant in U.S.-Russia trade relations. Russia continues to work to bring its technical regulations, including those related to product and food safety, into conformity with international standards.

.
GDP (2010): $1.477 trillion.
Growth rate (2010): 3.8%.
Natural resources: Petroleum, natural gas, timber, furs, precious and nonferrous metals.
Agriculture: Products--Grain, sugar beets, sunflower seeds, meat, dairy products.
Industry: Types--Complete range of manufactures: automobiles, trucks, trains, agricultural equipment, advanced aircraft, aerospace, machine and equipment products; mining and extractive industry; medical and scientific instruments; construction equipment.
Trade (2010): Exports--$376.7 billion: petroleum and petroleum products, natural gas, woods and wood products, metals, chemicals. Major markets--EU, CIS, China, Japan. Imports--$191.8 billion: machinery and equipment, chemicals, consumer goods, medicines, meat, sugar, semi-finished metal products. Major partners--EU, CIS, Japan, China, U.S. U.S. exports--$6.0 billion. Principal U.S. exports (2010)--oil/gas equipment, meat, motor vehicles and parts, aircraft, electrical machinery, automatic data processing machines and parts, medical equipment, plastics, cosmetics, and chemicals. U.S. imports--$25.7 billion. Principal U.S. imports (2010)--oil, chemicals (including fertilizer), radioactive materials, iron/steel, precious stones, nickel, aluminum, fish and crustaceans, alcoholic beverages, and base metals.


Sunday 25 September 2011

Ukraine economy overview


Ukraine economy can be classified as developed economy, given its overall level of industrial and agricultural output. However, the economy of Ukraine suffered because of various weaknesses deriving from overcentralized command economy during Soviet period.

Ukraine economy past

Large and inefficient state-owned factories, enterprises and collective farms wasted resources and emphasized quantity over quality. Prices were arbitrarily set, and consumer goods were often in short supply. Excessive spending on the military hurt the civilian economy, while technological development lagged in the civilian sphere.

Ukraine market economy

For the last years Ukraine is moving to market economy, where the forces of supply and demand and private ownership guide the allocation of resources. The transition to market economy is politically and socially difficult because the populace must endure rising inflation, unemployment, and economic uncertainty before it experiences the long-term benefits of market economy.
In addition, Ukraine redefines its economic relations with Russia and other former Soviet republics. As a way of safeguarding its political independence and limiting its economic vulnerability, Ukraine has its own national currency, called the hryvnia, from 1992. The economic reforms also cut military production and convert military factories and technologies to benefit the civilian economy and the populace.

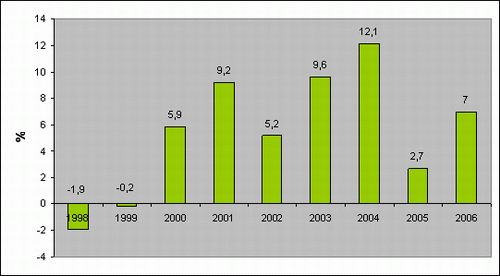
Ukraine economy real GDP dynamics 1998-2006

Ukraine economy real GDP dynamics 1998-2006

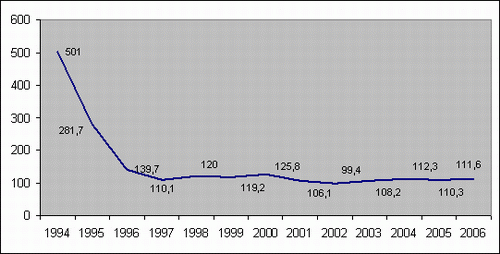
Ukraine economy consumer prices dynamics 1994-2006

Ukraine economy consumer prices dynamics 1994-2006

Ukraine economy: Agriculture

Historically, Ukraine is well known for its agricultural production. Among its main agricultural products are sugar beets, wheat, meat, and dairy products. Other crops include barley, corn, rye, and tobacco.
Most Ukraine farms are very large state-owned farms of more than 8,000 acres (3,000 ha). Smaller private plots have historically been the most productive throughout the former Soviet Union, and their importance should grow in the future.

Ukraine economy: Resources

Ukraine mineral resources have played an important role in supporting Ukraine industrial development and in providing for its energy needs. During the 1980s nuclear power also became a significant source of electrical power, accounting for about 25% of Ukraine’s electricity.
The accident at Chernobyl power station in 1986, however, created strong opposition to nuclear power in Ukraine, and efforts are now being made to phase out reliance on nuclear energy.

Ukraine economy: Industries

Ukrainian major industries are metalworks, machine building, construction, chemicals, food, and light industry. Ukraine is a major producer of steel and iron. Ukraine accounted for 33% of Soviet steel and iron production. About one-third of its industrial manufacturing comes from machine-building sector, which produces tractors, machine tools, and mining equipment.
Transportation vehicles manufactured by Ukraine economy include cars, trucks, buses, railway cars, diesel locomotives, airplanes, and ships.
The chief output of Ukrainian chemical industry is fertilizer, while Ukrainian food industry is involved with sugar refining, meat packaging, food canning, and wine production. Among consumer goods produced are television sets, refrigerators, washing machines, and clothes.

Ukraine economy: Transportation system

Overall, Ukraine has a well-developed and diverse transportation system. Ukrainian railroad network is extensive and links major cities with industrial enterprises. Waterways such as Dnepr River and Black Sea and Azov sea, and their port cities, play an important role in shipping.
Ukrainian highway system comprises about 147,000 kilometers (91,000 miles) of paved roads. Ukrainian subway systems exist in Kiev and Kharkov. There are major airports near Kiev (at Boryspil), Kharkov and Odessa cities.

Ukraine economy: Export and Import

Ukrainian major exports include grain, sugar beets, coal, construction equipment, and select manufactured goods.
The primary Ukrainian import items are oil, natural gas, wood products, rubber, and consumer goods. Some of Ukraine major trading partners are Russia, Poland, USA, Hungary, Germany, France, and Iran. Ukraine is seeking to reduce its economic ties with Russia.

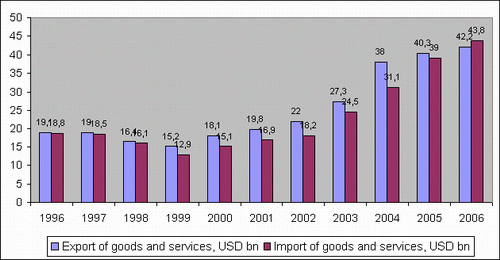
Ukraine economy export and import 1996-2006

Ukraine economy export and import 1996-2006

Chile's Economy Profile

Chile has a market-oriented economy characterized by a high level of foreign trade and a reputation for strong financial institutions and sound policy that have given it the strongest sovereign bond rating in South America. Exports account for more than one-fourth of GDP, with commodities making up some three-quarters of total exports. Copper alone provides one-third of government revenue. During the early 1990s, Chile's reputation as a role model for economic reform was strengthened when the democratic government of Patricio AYLWIN - which took over from the military in 1990 - deepened the economic reform initiated by the military government. Growth in real GDP averaged 8% during 1991-97, but fell to half that level in 1998 because of tight monetary policies implemented to keep the current account deficit in check and because of lower export earnings - the latter a product of the global financial crisis. A severe drought exacerbated the situation in 1999, reducing crop yields and causing hydroelectric shortfalls and electricity rationing, and Chile experienced negative economic growth for the first time in more than 15 years. In the years since then, growth has averaged 4% per year. Chile deepened its longstanding commitment to trade liberalization with the signing of a free trade agreement with the US, which took effect on 1 January 2004. Chile claims to have more bilateral or regional trade agreements than any other country. It has 57 such agreements (not all of them full free trade agreements), including with the European Union, Mercuric, China, India, South Korea, and Mexico. Over the past seven years, foreign direct investment inflows have quadrupled to some $15 billion in 2010, but FDI had dropped to about $7 billion in 2009 in the face of diminished investment throughout the world. The Chilean government conducts a rule-based counter cyclical fiscal policy, accumulating surpluses in sovereign wealth funds during periods of high copper prices and economic growth, and allowing deficit spending only during periods of low copper prices and growth. As of September 2008, those sovereign wealth funds - kept mostly outside the country and separate from Central Bank reserves - amounted to more than $20 billion. Chile used $4 billion from this fund to finance a fiscal stimulus package to fend off recession. In December 2009, the OECD invited Chile to become a full member, after a two year period of compliance with organization mandates. The economy started to show signs of a rebound in the fourth quarter, 2009, and GDP grew more than 5% in 2010. The magnitude 8.8 earthquake that struck Chile in February 2010 was one of the top ten strongest earthquakes on record. It caused considerable damage near the epicenter, located about 70 miles from Concepcion - and about 200 miles southwest of Santiago.
GDP (purchasing power parity):
$260 billion (2010 est.)
country comparison to the world: 46

$246.9 billion (2009 est.)

$250.6 billion (2008 est.)
note: data are in 2010 US dollars
[see also: GDP (purchasing power parity) country ranks ]GDP (official exchange rate):
$199.2 billion (2009 est.)
[see also: GDP (official exchange rate) country ranks ]
GDP - real growth rate:
5.3% (2010 est.)
country comparison to the world: 47

-1.5% (2009 est.)

3.7% (2008 est.)
[see also: GDP - real growth rate country ranks ]GDP - per capita:
$15,500 (2010 est.)
country comparison to the world: 73

$14,900 (2009 est.)

$15,200 (2008 est.)
note: data are in 2010 US dollars
[see also: GDP - per capita country ranks ]GDP - composition by sector:
agriculture: 5.6%
[see also: GDP - composition by sector - agriculture country ranks ]
industry: 40.5%
[see also: GDP - composition by sector - industry country ranks ]
services: 53.9% (2008 est.)
[see also: GDP - composition by sector - services country ranks ]
Labor force:
7.58 million (2009 est.)
country comparison to the world: 61
[see also: Labor force country ranks ]
Labor force - by occupation:
agriculture: 13.2%
[see also: Labor force - by occupation - agriculture country ranks ]
industry: 23%
[see also: Labor force - by occupation - industry country ranks ]
services: 63.9% (2005)
[see also: Labor force - by occupation - services country ranks ]
Unemployment rate:
8.7% (2010 est.)
country comparison to the world: 100

9.6% (2009 est.)
[see also: Unemployment rate country ranks ]Population below poverty line:
18.2% (2005)
[see also: Population below poverty line country ranks ]
Household income or consumption by percentage share:
lowest 10%: 1.6%
[see also: Household income or consumption by percentage share - lowest 10% country ranks ]
highest 10%: 41.7% (2006)
[see also: Household income or consumption by percentage share - highest 10% country ranks ]
Distribution of family income - Gini index:
54.9 (2003)
country comparison to the world: 14

57.1 (2000)
[see also: Distribution of family income - Gini index country ranks ]Investment (gross fixed):
23.5% of GDP (2009 est.)
country comparison to the world: 52
[see also: Investment (gross fixed) country ranks ]
Budget:
revenues: $40.97 billion
[see also: Budget - revenues country ranks ]
expenditures: $45.07 billion (2009 est.)
[see also: Budget - expenditures country ranks ]
Public debt:
6.2% of GDP (2010 est.)
country comparison to the world: 126

6.1% of GDP (2009 est.)
[see also: Public debt country ranks ]Inflation rate (consumer prices):
1.7% (2010 est.)
country comparison to the world: 45

1.5% (2009 est.)
[see also: Inflation rate (consumer prices) country ranks ]Central bank discount rate:
0.5% (31 December 2009)
country comparison to the world: 52

8.25% (31 December 2008)
[see also: Central bank discount rate country ranks ]Commercial bank prime lending rate:
7.25% (31 December 2009 est.)
country comparison to the world: 60

13.26% (31 December 2008 est.)
[see also: Commercial bank prime lending rate country ranks ]Stock of narrow money:
$29.81 billion (31 December 2010 est)

$23.68 billion (31 December 2009 est)
[see also: Stock of narrow money country ranks ]Stock of broad money:
$160.3 billion (31 December 2009)

$127.5 billion (31 December 2008)
[see also: Stock of broad money country ranks ]Stock of domestic credit:
$153.6 billion (31 December 2010 est.)
country comparison to the world: 41

$133.7 billion (31 December 2009 est.)
[see also: Stock of domestic credit country ranks ]Market value of publicly traded shares:
$209.5 billion (31 December 2009)
country comparison to the world: 30

$132.4 billion (31 December 2008)

$212.9 billion (31 December 2007)
[see also: Market value of publicly traded shares country ranks ]Agriculture - products:
grapes, apples, pears, onions, wheat, corn, oats, peaches, garlic, asparagus, beans; beef, poultry, wool; fish; timber

Industries:
copper, other minerals, foodstuffs, fish processing, iron and steel, wood and wood products, transport equipment, cement, textiles

Industrial production growth rate:
3.2% (2009 est.)
country comparison to the world: 97
[see also: Industrial production growth rate country ranks ]

Electricity - production:
60.6 billion kWh (2007 est.)
country comparison to the world: 41
[see also: Electricity - production country ranks ]

Electricity - consumption:
57.29 billion kWh (2007 est.)
country comparison to the world: 43
[see also: Electricity - consumption country ranks ]

Electricity - exports:
0 kWh (2008 est.)
[see also: Electricity - exports country ranks ]

Electricity - imports:
1.628 billion kWh (2007 est.)
[see also: Electricity - imports country ranks ]

Oil - production:
10,850 bbl/day (2009 est.)
country comparison to the world: 84
[see also: Oil - production country ranks ]

Oil - consumption:
277,000 bbl/day (2009 est.)
country comparison to the world: 47
[see also: Oil - consumption country ranks ]

Oil - exports:
49,250 bbl/day (2007 est.)
country comparison to the world: 80
[see also: Oil - exports country ranks ]

Oil - imports:
311,200 bbl/day (2007 est.)
country comparison to the world: 36
[see also: Oil - imports country ranks ]

Oil - proved reserves:
150 million bbl (1 January 2010 est.)
country comparison to the world: 63
[see also: Oil - proved reserves country ranks ]

Natural gas - production:
1.65 billion cu m (2008 est.)
country comparison to the world: 60
[see also: Natural gas - production country ranks ]

Natural gas - consumption:
2.34 billion cu m (2008 est.)
country comparison to the world: 79
[see also: Natural gas - consumption country ranks ]

Natural gas - exports:
0 cu m (2008 est.)
country comparison to the world: 189
[see also: Natural gas - exports country ranks ]

Natural gas - imports:
690 million cu m (2008 est.)
country comparison to the world: 58
[see also: Natural gas - imports country ranks ]

Natural gas - proved reserves:
97.97 billion cu m (1 January 2010 est.)
country comparison to the world: 53
[see also: Natural gas - proved reserves country ranks ]

Current account balance:
$1.033 billion (2010 est.)
country comparison to the world: 45

$4.217 billion (2009 est.)
[see also: Current account balance country ranks ]Exports:
$64.28 billion (2010 est.)
country comparison to the world: 45

$53.74 billion (2009 est.)
[see also: Exports country ranks ]Exports - commodities:
copper, fruit, fish products, paper and pulp, chemicals, wine

Exports - partners:
China 16.46%, US 11.31%, Japan 9.06%, South Korea 6.49%, Brazil 4.64%, Mexico 4.09% (2009)

Imports:
$54.23 billion (2010 est.)
country comparison to the world: 46

$39.75 billion (2009 est.)
[see also: Imports country ranks ]Imports - commodities:
petroleum and petroleum products, chemicals, electrical and telecommunications equipment, industrial machinery, vehicles, natural gas

Imports - partners:
US 21.77%, China 12.76%, Argentina 9.55%, Brazil 6.46%, South Korea 5.35% (2009)

Reserves of foreign exchange and gold:
$26.08 billion (31 December 2010 est.)
country comparison to the world: 37

$25.29 billion (31 December 2009 est.)
[see also: Reserves of foreign exchange and gold country ranks ]Debt - external:
$84.51 billion (31 December 2010 est.)
country comparison to the world: 40

$72.76 billion (31 December 2009 est.)
[see also: Debt - external country ranks ]Stock of direct foreign investment - at home:
$136.3 billion (31 December 2010 est.)
country comparison to the world: 26

$121.6 billion (31 December 2009 est.)
[see also: Stock of direct foreign investment - at home country ranks ]Stock of direct foreign investment - abroad:
$51.15 billion (31 December 2010 est.)
country comparison to the world: 33

$41.2 billion (31 December 2009 est.)
[see also: Stock of direct foreign investment - abroad country ranks ]Exchange rates:
Chilean pesos (CLP) per US dollar - 525.34 (2010), 560.86 (2009), 509.02 (2008), 526.25 (2007), 530.29 (2006)